Belated happy new year! Fingers crossed 2022 is better.
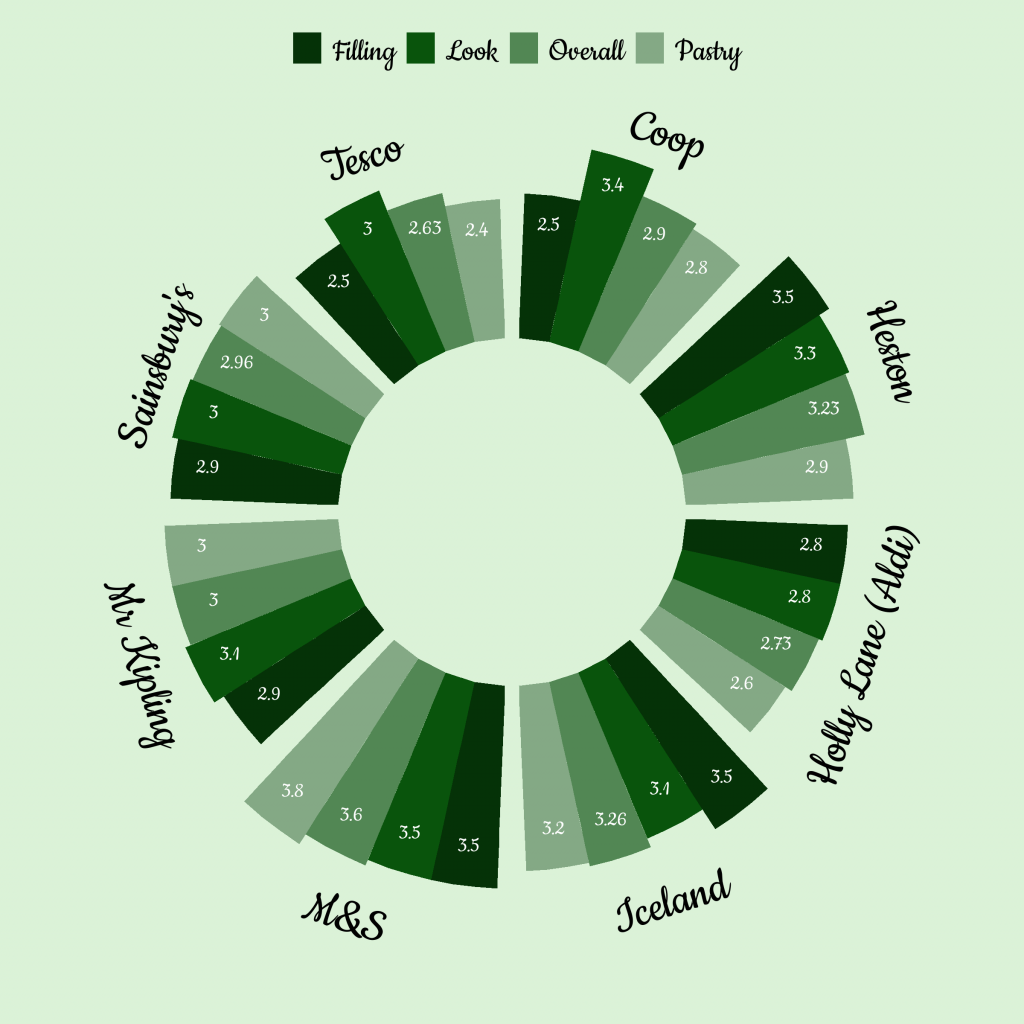
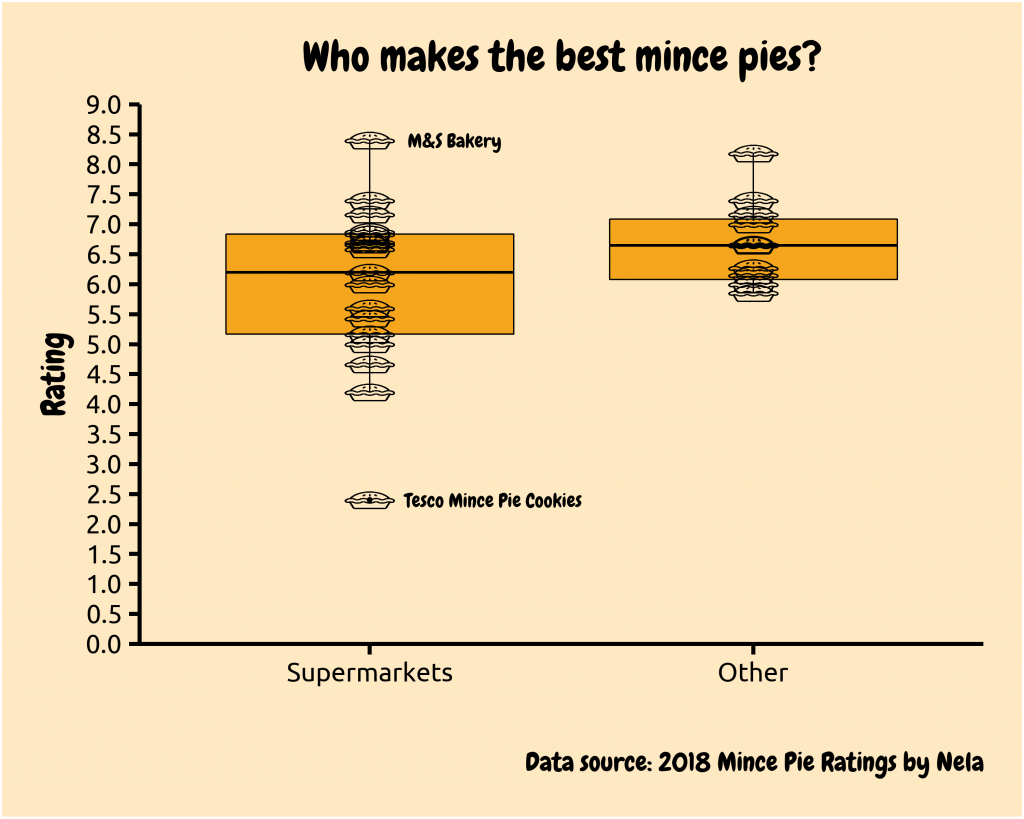
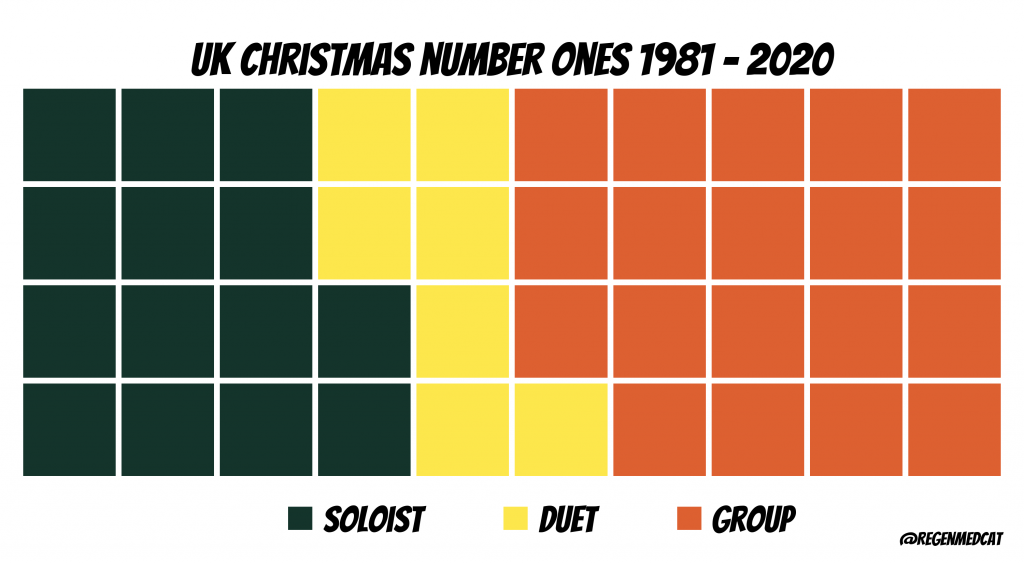
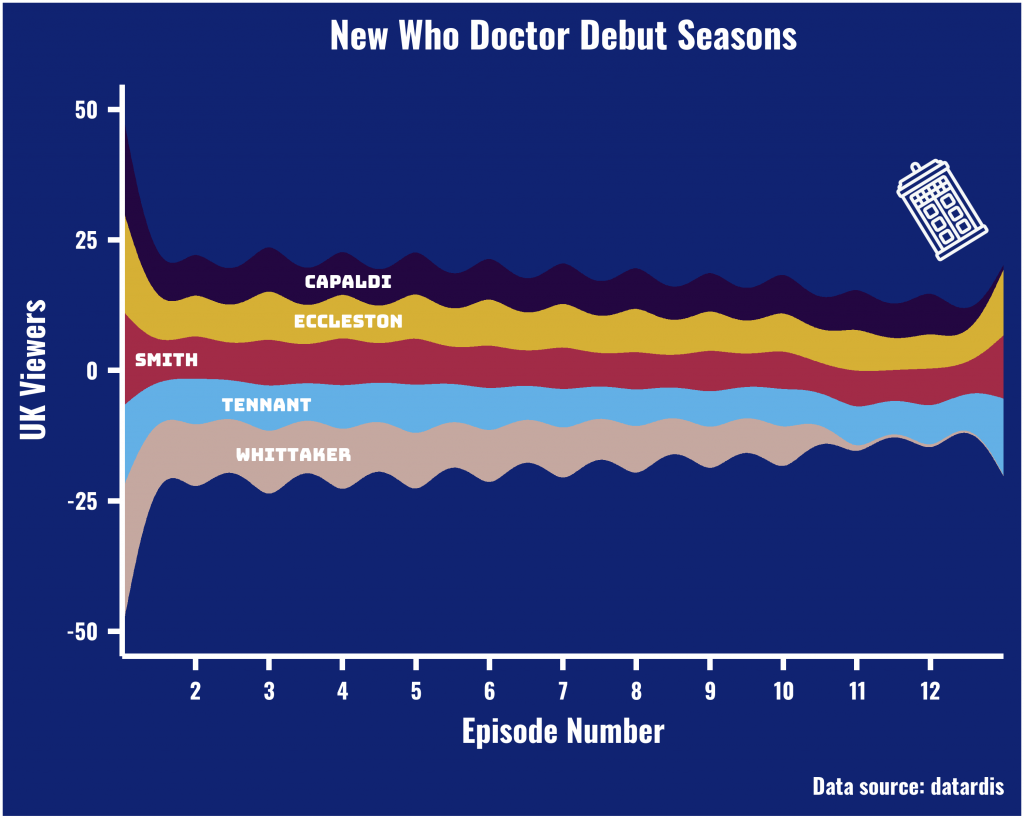
Towards the end of last year I decided to set myself an advent calendar challenge to make a data visualisation using R for every day from December 1-24th. It was a ridiculous idea mostly because I tend to obsess over every small detail and spend hours on one graph. It was definitely trying at times but worth it because I completed it! 🎉 More importantly, I feel like I levelled up my R skills. I plotted a couple of graph types for the first time including waffle and radar charts. Here’s some of my highlights. All my code is available on my GitHub repo and if search #RStatsAdvents on Twitter, you can find all my plots.